Basic Usage
FlowCraft has currently two execution modes, build and inspect, that are
used to build and inspect the nextflow pipeline, respectively. However, a
report mode is also being developed.
Build
Assembling a pipeline
Pipelines are generated using the build mode of FlowCraft
and the -t parameter to specify the components inside quotes:
flowcraft build -t "trimmomatic fastqc spades" -o my_pipe.nf
All components should be written inside quotes and be space separated. This command will generate a linear pipeline with three components on the current working directory (for more features and tips on how pipelines can be built, see the pipeline building section). A linear pipeline means that there are no bifurcations between components, and the input data will flow linearly.
The rationale of how the data flows across the pipeline is simple and intuitive.
Data enters a component and is processed in some way, which may result on the
creation of result files (stored in the results directory) and reports
files (stored in the reports directory) (see Results and reports below). If that
component has an output_type, it will feed the processed data into the
next component (or components) and this will repeated until the end of the
pipeline.
If you are interesting in checking the pipeline DAG tree, open the
my_pipe.html file (same name as the pipeline with the html extension)
in any browser.
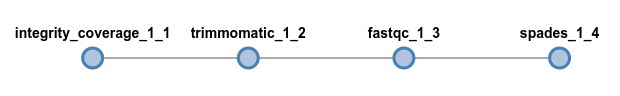
The integrity_coverage component is a dependency of trimmomatic, so
it was automatically added to the pipeline.
Important
Not all pipeline configurations will work. You always need to ensure that the output type of a component matches the input type of the next component, otherwise FlowCraft will exit with an error.
Pipeline directory
In addition to the main nextflow pipeline file (my_pipe.nf),
FlowCraft will write several auxiliary files that are necessary for
the pipeline to run. The contents of the directory should look something like
this:
$ ls
bin                lib           my_pipe.nf       params.config     templates
containers.config  my_pipe.html  nextflow.config  profiles.config   resources.config  user.config
You do not have to worry about most of these files. However, the
*.config files can be modified to change several aspects of the pipeline run
(see Pipeline configuration for more details). Briefly:
params.config: Contains all the available parameters of the pipeline (see Parameters below). These can be changed here, or provided directly on run-time (e.g.:nextflow run --fastq value).resources.config: Contains the resource directives of the pipeline processes, such as cpus, allocated RAM and other nextflow process directives.containers.config: Specifies the container and version tag of each process in the pipeline.profiles.config: Contains a number of predefined profiles of executor and container engine.user.config: Empty configuration file that is not over-written if you build another pipeline in the same directory. Used to set persistent configurations across different pipelines.
Parameters
The parameters of the pipeline can be viewed by running the pipeline file
with nextflow and using the --help option:
$ nextflow run my_pipe.nf --help
N E X T F L O W  ~  version 0.30.1
Launching `my_pipe.nf` [kickass_mcclintock] - revision: 480b3455ba

============================================================
                F L O W C R A F T
============================================================
Built using flowcraft v1.2.1.dev1


Usage:
    nextflow run my_pipe.nf

       --fastq                     Path expression to paired-end fastq files. (default: fastq/*_{1,2}.*) (default: 'fastq/*_{1,2}.*')

       Component 'INTEGRITY_COVERAGE_1_1'
       ----------------------------------
       --genomeSize_1_1            Genome size estimate for the samples in Mb. It is used to estimate the coverage and other assembly parameters andchecks (default: 1)
       --minCoverage_1_1           Minimum coverage for a sample to proceed. By default it's setto 0 to allow any coverage (default: 0)

       Component 'TRIMMOMATIC_1_2'
       ---------------------------
       --adapters_1_2              Path to adapters files, if any. (default: 'None')
       --trimSlidingWindow_1_2     Perform sliding window trimming, cutting once the average quality within the window falls below a threshold (default: '5:20')
       --trimLeading_1_2           Cut bases off the start of a read, if below a threshold quality (default: 3)
       --trimTrailing_1_2          Cut bases of the end of a read, if below a threshold quality (default: 3)
       --trimMinLength_1_2         Drop the read if it is below a specified length  (default: 55)

       Component 'FASTQC_1_3'
       ----------------------
       --adapters_1_3              Path to adapters files, if any. (default: 'None')

       Component 'SPADES_1_4'
       ----------------------
       --spadesMinCoverage_1_4     The minimum number of reads to consider an edge in the de Bruijn graph during the assembly (default: 2)
       --spadesMinKmerCoverage_1_4 Minimum contigs K-mer coverage. After assembly only keep contigs with reported k-mer coverage equal or above this value (default: 2)
       --spadesKmers_1_4           If 'auto' the SPAdes k-mer lengths will be determined from the maximum read length of each assembly. If 'default', SPAdes will use the default k-mer lengths.  (default: 'auto')
All these parameters are specific to the components of the pipeline. However,
the main input parameter (or parameters) of the pipeline is always available.
In this case, since the pipeline started with fastq paired-end files as the
main input, the --fastq parameter is available. If the pipeline started
with any other input type or with more than one input type, the appropriate
parameters will appear (more information in the raw input types section).
The parameters are composed by their name (adapters) followed by the ID of
the process it refers to (_1_2). The IDs can be consulted in the DAG tree
(See Assembling a pipeline). This is done to prevent issues when duplicating
components and, as such, all parameters will be independent between different
components. This
behaviour can be changed when building the pipeline by using the
--merge-params option (See Merge parameters).
Note
The --merge-params option of the build mode will merge all parameters
with identical names (e.g.: --genomeSize_1_1 and --genomeSize_1_5
become simply --genomeSize) . This is usually more appropriate and useful
in linear pipelines without component duplication.
Providing/modifying parameters
These parameters can be provided on run-time:
nextflow run my_pipe.nf --genomeSize_1_1 5 --adapters_1_2 "/path/to/adapters"
or edited in the params.config file:
params {
    genomeSize_1_1 = 5
    adapters_1_2 = "path/to/adapters"
}
Most parameters in FlowCraft’s components already come with sensible
defaults, which means that usually you’ll only need to provide a small number
of arguments. In the example above, the --fastq is the only parameter
required. I have placed fastq files on the data directory:
$ ls data
sample_1.fastq.gz  sample_2.fastq.gz
We’ll need to provide the pattern to the fastq files. This pattern is perhaps a bit confusing at first, but it’s necessary for the correct inference of the paired:
--fastq "data/*_{1,2}.*"
In this case, the pairs are separated by the “_1.” or “_2.” substring, which leads
to the pattern *_{1,2}.*. Another common nomenclature for paired fastq
files is something like sample_R1_L001.fastq.gz. In this case, an
acceptable pattern would be *_R{1,2}_*.
Important
Note the quotes around the fastq path pattern. These quotes are necessary to allow nextflow to resolve the pattern, otherwise your shell might try to resolve it and provide the wrong input to nextflow.
Execution
Once you build your pipeline with Flowcraft you have a standard nextflow pipeline ready to run. Therefore, all you need to do is:
nextflow run my_pipe.nf --fastq "data/*_{1,2}.*
Changing executor and container engine
The default run mode of an FlowCraft pipeline is to be executed locally
and using the singularity container engine. In nextflow terms, this is
equivalent to have executor = "local" and singularity.enabled = true.
If you want to change these settings, you can modify the
nextflow.config file, or use one of the available profiles in the
profiles.config file. These profiles provide a combination of common
<executor>_<container_engine> that are supported by nextflow. Therefore,
if you want to run the pipeline on a cluster with SLURM and shifter, you’ll
just need to specify the `` slurm_shifter`` profile:
nextflow run my_pipe.nf --fastq "data/*_{1,2}.*" -profile slurm_shifter
Common executors include:
slurmsgelsfpbs
Other container engines are:
dockersingularityshifter
Docker images
All components of FlowCraft are executed in containers, which means that
the first time they are executed in a machine, the corresponding image will have
to be downloaded. In the case of docker, images are pulled and stored in
var/lib/docker by default. In the case of singularity, the
nextflow.config generated by FlowCraft sets the cache dir for the
images at $HOME/.singularity_cache. Note that when an image is downloading,
nextflow does not display any informative message, except for singularity where you’ll
get something like:
Pulling Singularity image docker://ummidock/trimmomatic:0.36-2 [cache /home/diogosilva/.singularity_cache/ummidock-trimmomatic-0.36-2.img]
So, if a process seems to take too long to run the first time, it’s probably because the image is being downloaded.
Results and reports
As the pipeline runs, processes may write result and report files to the
results and reports directories, respectively. For example, the
reports of the pipeline above, would look something like this:
reports
├── coverage_1_1
│   └── estimated_coverage_initial.csv
├── fastqc_1_3
│   ├── FastQC_2run_report.csv
│   ├── run_2
│   │   ├── sample_1_0_summary.txt
│   │   └── sample_1_1_summary.txt
│   ├── sample_1_1_trim_fastqc.html
│   └── sample_1_2_trim_fastqc.html
└── status
    ├── master_fail.csv
    ├── master_status.csv
    └── master_warning.csv
The estimated_coverage_initial.csv file contains a very rough coverage
estimation for each sample, the fastqc* directory contains the html
reports and summary files of FastQC for each sample, and the status
directory contains a log of the status, warnings and fails of each process for
each sample.
The actual results for each process that produces them, are stored in the
results directory:
results
├── assembly
│   └── spades_1_4
│       └── sample_1_trim_spades3111.fasta
└── trimmomatic_1_2
    ├── sample_1_1_trim.fastq.gz
    └── sample_1_2_trim.fastq.gz
If you are interested in checking the actual environment where the execution
of a particular process occurred for any given sample, you can inspected the
pipeline_stats.txt file in the root of the pipeline directory. This file
contains rich information about the execution of each process, including
the working directory:
task_id hash        process         tag         status      exit    start                   container                           cpus    duration    realtime    queue   %cpu    %mem    rss     vmem
5       7c/cae270   trimmomatic_1_2 sample_1    COMPLETED   0       2018-04-12 11:42:29.599 docker:ummidock/trimmomatic:0.36-2  2       1m 25s      1m 17s      -       329.3%  1.1%    1.5 GB  33.3 GB
The hash column contains the start of the current working directory of that
process. In the example below, the directory would be:
work/7c/cae270*
Inspect
FlowCraft has two options (overview and broadcast) for inspecting the
progress of a pipeline that is running locally, either in a personal computer
or a server machine. In both cases, the progress of the pipeline will be
continuously updated in real-time.
In a terminal
To open inspect in the terminal just write the following command on the folder that the pipeline is running:
flowcraft inspect
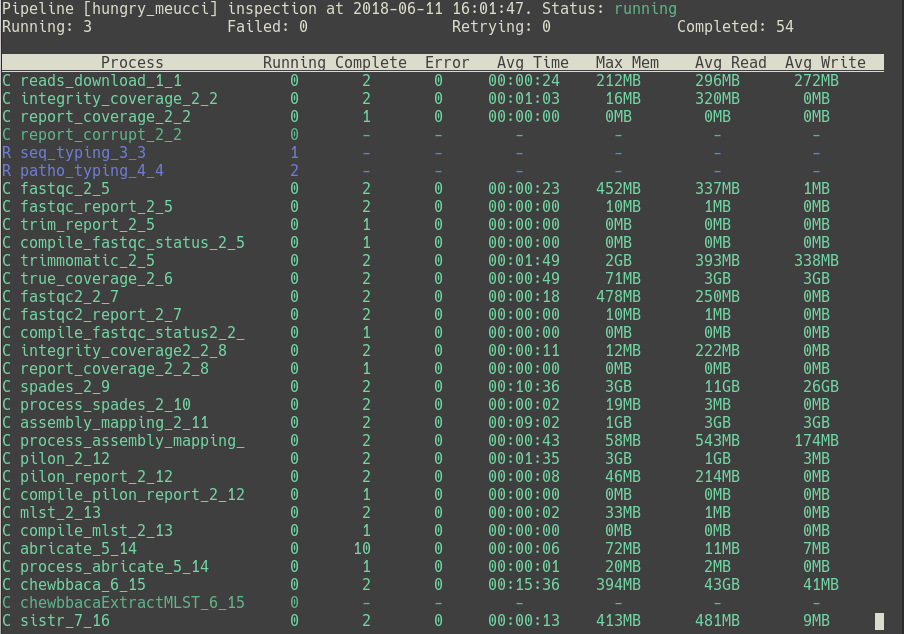
overview is the default behavior of this module, but it can also be called
like this:
flowcraft inspect -m overview
Note
To exit the inspection just type q or ctrl+c.
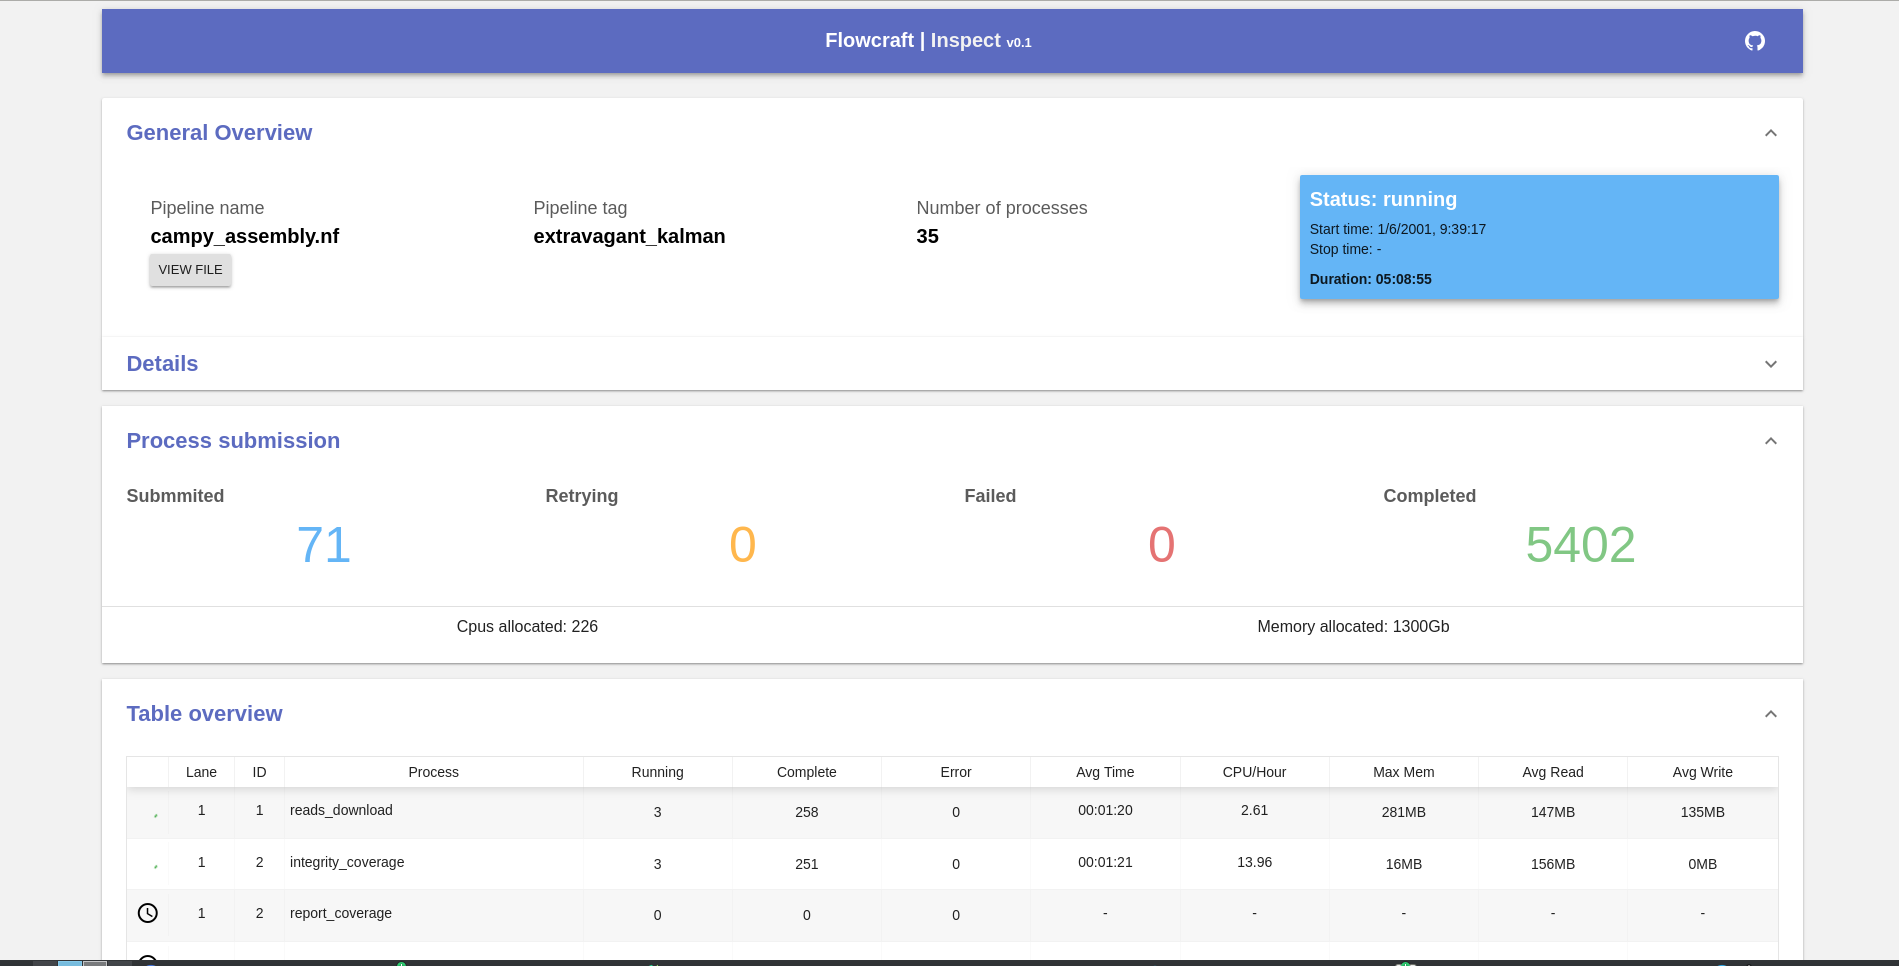
In a browser
It is also possible to track the pipeline progress in a browser in any device using the flowcraft web application. To do so, the following command should be run in the folder where the pipeline is running:
flowcraft inspect -m broadcast
This will output an URL to the terminal that can be opened in a browser. This is an example of the screen that is displayed once the url is opened:
Important
This pipeline inspection will be available for anyone via the provided URL,
which means that the URL can be shared with anyone and/or any device with
a browser. However, the inspection section will only be available while
the flowcraft inspect -m broadcast command is running. Once this command
is cancelled, the data will be erased from the service and the URL will
no longer be available.
Want to know more?
Pipeline inspection is the full documentation of the inspect mode.
Reports
The reporting of a FlowCraft pipeline is saved on a JSON file that is stored
in pipeline_reports/pipeline_report.json. To visualize the reports you’ll just
need to execute the following command in the folder where the pipeline was executed:
flowcraft report
This will output an URL to the terminal that can be opened in a browser. This is an example of the screen that is displayed once the url is opened:
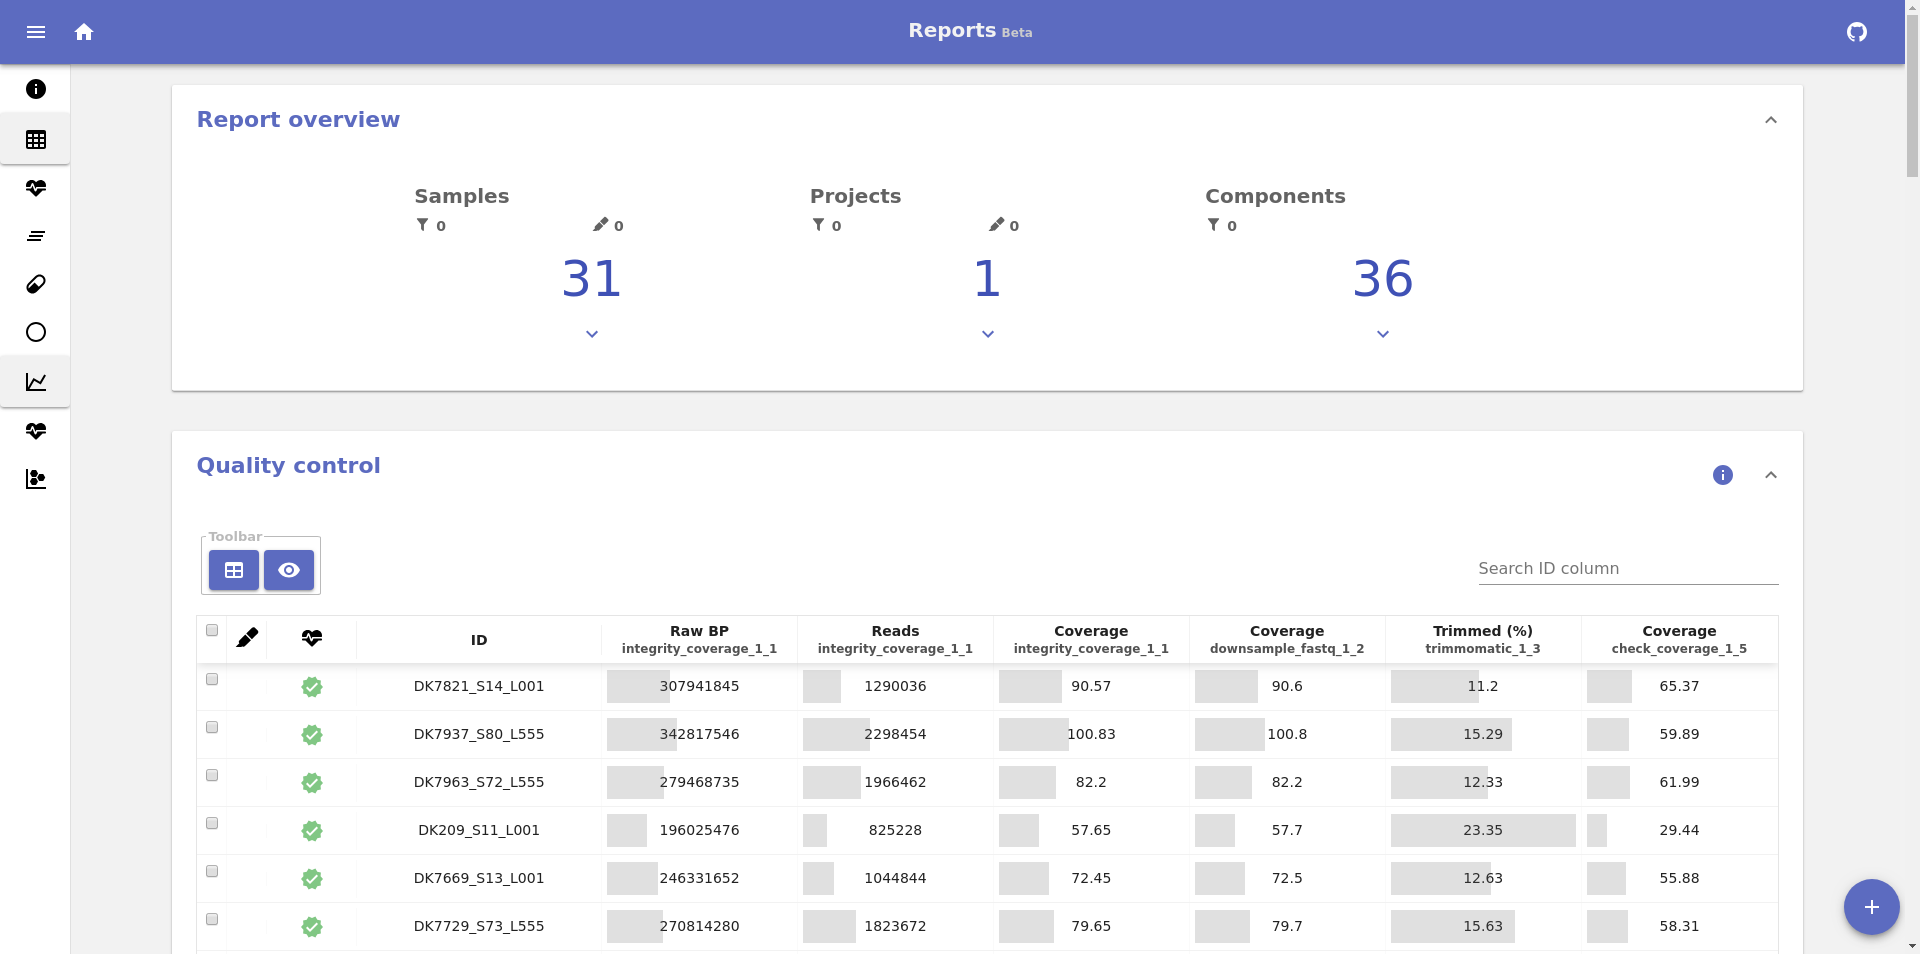
The actual layout and content of the reports will depend on the pipeline you build and it will only provide the information that is directly related to your pipeline components.
Important
This pipeline report will be available for anyone via the provided URL,
which means that the URL can be shared with anyone and/or any device with
a browser. However, the report section will only be available while
the flowcraft report command is running. Once this command
is cancelled, the data will be erased from the service and the URL will
no longer be available.
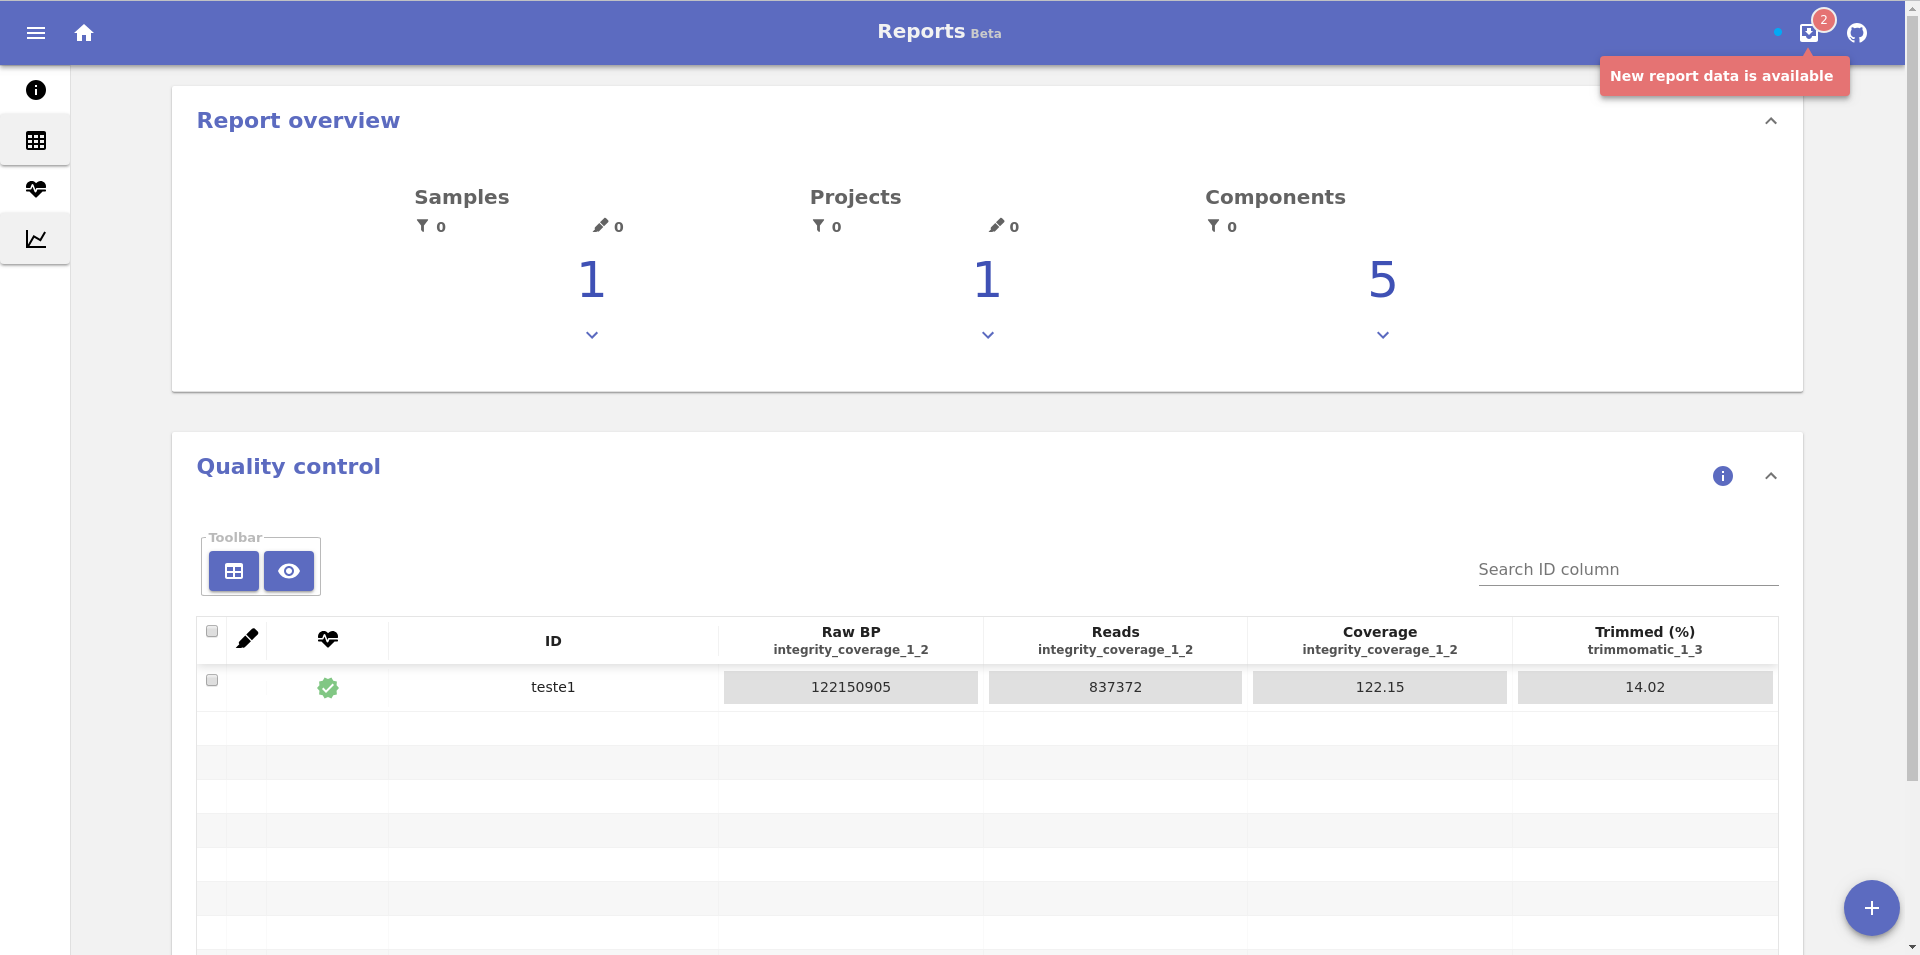
Real time reports
The reports of any FlowCraft pipeline can be monitored in real-time using the
--watch option:
flowcraft report --watch
This will output an URL exactly as in the previous section and will render the same reports page with a small addition. In the top right of the screen in the navigation bar, there will be a new icon that informs the user when new reports are available:
Local visualization
The FlowCraft report JSON file can also be visualized locally by drag and dropping it into the FlowCraft web application page, currently hosted at http://www.flowcraft.live/reports
Offline visualization
The complete FlowCraft report is also available as a standalone HTML file that
can be visualized offline. This HTML file, stored in
pipeline_reports/pipeline_report.html, can be opened in any modern browser.